The crises experienced in maritime trade over recent years have revealed the extent of interdependence between major ports and shipping lines, and how disruption in one of the key maritime corridors or hubs can extend its impact on the flow of goods between continents, affecting production costs and price levels.
The estimates from the United Nations Conference on Trade and Development (UNCTAD), indicating that about 80% of global goods trade by volume is transported via maritime shipping, reflect the importance of these networks, making ports, ships, and associated infrastructures an essential part of the global economy.
However, the influence of the maritime transport sector cannot be simplified to the countries hosting the largest ports; there are companies that control the operation of huge fleets of container ships and other countries that own significant shares of the global commercial fleet.
What are the largest ports relied upon for international trade, who controls the fleets of ships that connect global markets, and is the size of the ports or the number of ships sufficient to determine the strategic importance of these entities in the global economy?
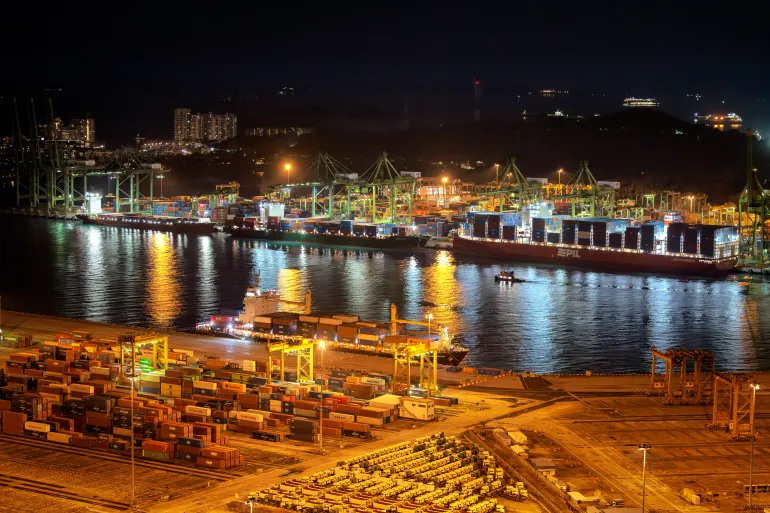
The largest 10 container ports in the world
Asian ports dominate global container movement, driven by the expansion of industrial and export activity in China, alongside the role played by transshipment hubs in linking international markets, such as Singapore and Busan in South Korea.
Data for 2025 shows China holding 6 out of the top 10 container ports globally, with the Port of Shanghai maintaining its lead, surpassing the Port of Singapore, which retains its status as one of the most important maritime transshipment centers in the world.
The following are the largest 10 container ports worldwide in 2025 (according to annual throughput):
Shanghai – China: 55.06 million twenty-foot equivalent units (TEUs).
Singapore – Singapore: 44.66 million TEUs.
Ningbo Zhoushan – China: 43.87 million TEUs.
Shenzhen – China: 35.41 million TEUs.
Qingdao – China: 34.20 million TEUs.
Guangzhou – China: 28.05 million TEUs.
Busan – South Korea: 24.88 million TEUs.
Tianjin – China: 24.03 million TEUs.
Jebel Ali – United Arab Emirates: about 15.6 million TEUs.
Port Klang – Malaysia: about 15.1 million TEUs.
This dominance reflects not just the scale of the Chinese economy, but also highlights the importance of maritime infrastructure in supporting export capacity, as the extensive network of ports allows for the transportation of industrial products and raw materials to international markets across multiple shipping routes, avoiding the risks associated with reliance on a single line.
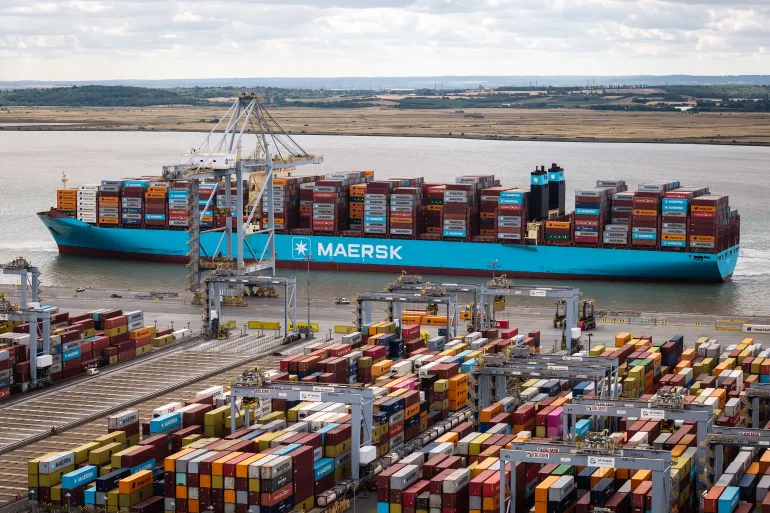
The largest 10 container shipping companies in the world
While major ports represent key centers for the trade of goods, shipping companies determine how these goods are transported between continents, through their networks of regular lines and the fleets they operate, granting these companies a direct impact on the available shipping capacity and the routes taken by goods.
Data from Alphaliner, which specializes in tracking container fleets, reveals that market activity is concentrated in the hands of a limited number of companies; the Mediterranean Shipping Company (MSC) of Switzerland alone accounts for more than one-fifth of the global container fleet capacity, followed by Denmark's Maersk Group and France's CMA CGM.
The following is a list of the top 10 container shipping companies globally according to fleet capacity:
MSC – Switzerland: 7.45 million TEUs.
Maersk – Denmark: 4.73 million TEUs.
CMA CGM – France: 4.47 million TEUs.
COSCO – China: 3.68 million TEUs.
Hapag-Lloyd – Germany: 2.41 million TEUs.
ONE – Singapore: 2.19 million TEUs.
Evergreen – Taiwan: 2.04 million TEUs.
HMM – South Korea: 1.03 million TEUs.
Yang Ming – Taiwan: 771,000 TEUs.
ZIM – Israel: 691,000 TEUs.
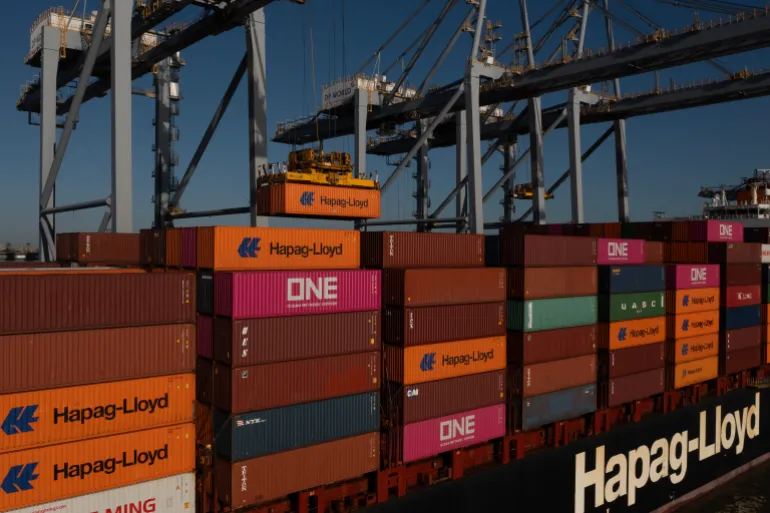
The ranking of companies reveals a significant difference from the map of ports; despite China leading in container handling activity, the top three shipping companies are all headquartered in Europe, reflecting the distribution of influence between the countries that dominate production and export and the companies managing the networks transporting goods across global markets.
The top three companies together, being Swiss, Danish, and French, account for approximately 48% of the world's container fleet capacity, which gives their decisions regarding ship distribution and shipping routes importance that goes beyond their direct commercial operations, especially when disruptions occur in one of the main maritime corridors.
However, this does not imply that companies can set transport prices unilaterally, as shipping prices are affected by multiple factors, including trade demand, available capacity in the market, fuel prices, port congestion, operating costs, as well as competition between companies and maritime alliances.
The largest 10 countries owning commercial fleets
Global maritime transport is not limited to container ships; it includes large fleets for transporting oil, gas, grains, coal, and metal ores, in addition to car and general cargo carriers, making the map of commercial ship ownership different from the map of ports and container shipping companies.
Greece leads the world in terms of the deadweight tonnage of the commercial fleet owned by its companies and investors, although its ports do not appear among the largest ports globally by container handling, with China and Japan following in the next positions.
Deadweight tonnage refers to the total weight that a ship can carry in terms of cargo, fuel, and supplies, which is why this indicator is used to compare the carrying capacity of commercial fleets, instead of relying on the number of ships, which does not necessarily reflect their sizes.
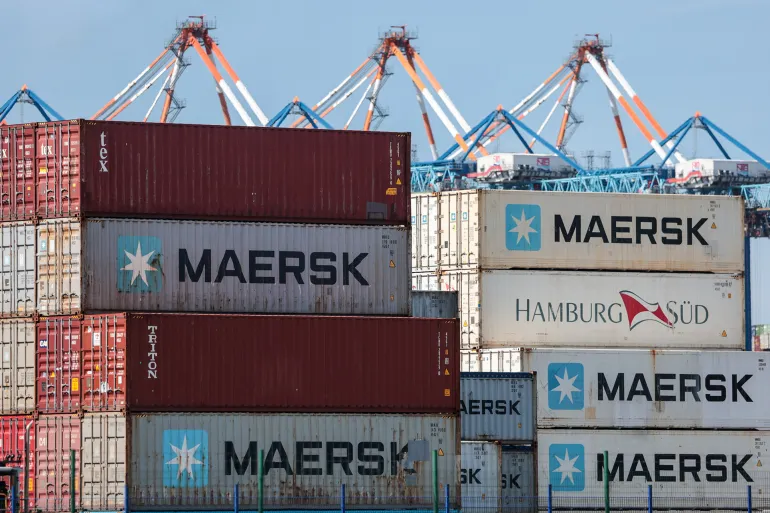
The following is a list of the largest 10 countries owning commercial fleets globally (by deadweight tonnage):
Greece: 397.65 million deadweight tons.
China: 347.22 million deadweight tons.
Japan: 240.68 million deadweight tons.
Singapore: 153.43 million deadweight tons.
Hong Kong – China: 139.50 million deadweight tons.
South Korea: 98.53 million deadweight tons.
Germany: 71.53 million deadweight tons.
Taiwan: 63.88 million deadweight tons.
United Arab Emirates: 57.43 million deadweight tons.
United Kingdom and Isle of Man: 56.99 million deadweight tons.
According to UNCTAD, the top ten countries together hold approximately 67.3% of the deadweight tonnage of the global commercial fleet, while Greece, China, and Japan alone account for more than 40% of the total.
However, this data does not mean that the ships registered under the flags of those countries are the same ones they own, as shipping companies frequently register their ships in other countries, such as Liberia, Panama, and the Marshall Islands, for reasons related to regulatory frameworks, taxation, and operational requirements for ships.
In conclusion, the map of global maritime transport reveals an important paradox; while most of the giant ports are concentrated in Asia, the ownership and management of ships are distributed among different groups and countries in Europe and Asia, making influence in global trade divided between those who own the infrastructure, those who own the ships, and those who can operate the transportation networks between them.
This may be the biggest challenge facing international trade; as transport networks become more efficient and interconnected, their capacity to move goods between continents increases, but they also become more sensitive to any disruptions affecting their core centers.